

Why the NHL Is a Bettor’s Market
Three years ago I placed a string of NHL moneyline bets purely on gut feeling — team names I recognised, jersey colours I liked, whatever felt right at puck drop. I went 4-11 in a fortnight and deserved every loss. Then I pulled the numbers apart and something clicked: the NHL is one of the last major professional leagues where the betting market routinely misprices games, and anyone willing to do an hour of homework per slate can find genuine edges.
The reason is simple economics. Not as many people bet on the NHL compared to football or basketball, so bookmakers invest less in sharpening their hockey lines. That imbalance leaves pockets of value sitting in plain sight — especially in the prop, period and puck line markets that casual punters ignore entirely. In the United States alone, legal sportsbooks processed $165.58 billion in handle during 2025 at an overall hold rate of 10.15%, yet hockey’s share of that action remains a sliver compared to the NFL or NBA. Smaller pools of money mean slower line movement, which means your edge can survive long enough to exploit.
The 2025-26 season has given us more data than ever. The NHL is projecting revenue in the $7.5-8 billion range for this campaign, broadcast deals are expanding global visibility, and the salary cap sits at $95.5 million with a projected leap to $104 million for 2026-27. All of that growth translates into deeper markets, more prop offerings and wider coverage from UK bookmakers — yet the analytical gap between what the data tells us and what the odds reflect has not closed. That gap is where I spend my working days, and in this piece I will walk you through the framework I use to find value in every NHL slate.
Finding Moneyline Value With Possession Data
I learned this the expensive way: watching a team dominate the shot clock for two periods, losing 1-0 on a fluke deflection, and then seeing them priced as underdogs the next night because the market only saw the L in the standings column. Possession data tells a different story, and it is almost always more accurate than the scoreboard over a meaningful sample.
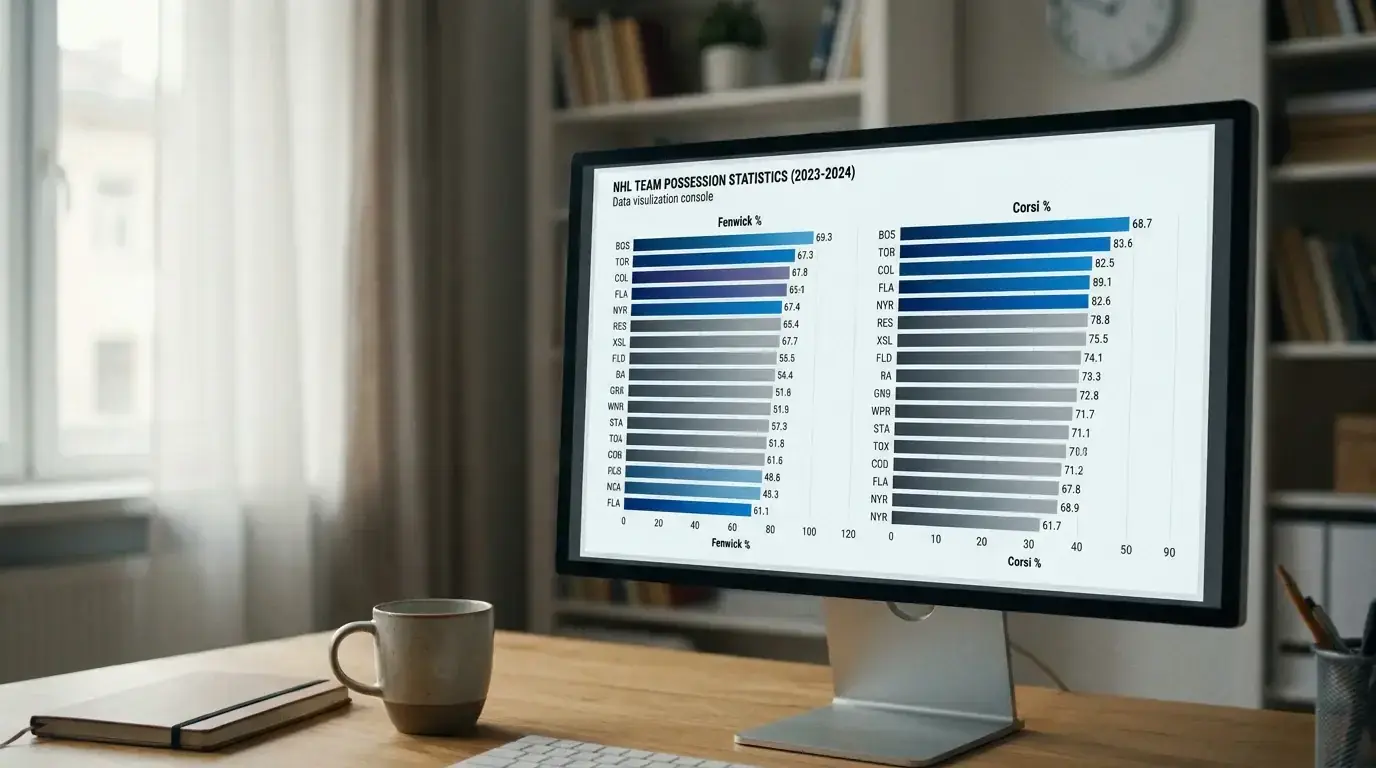
The metric I start with every morning is Corsi For Percentage — the share of total shot attempts a team generates at five-on-five. A CF% above 52% is considered very good; push past 55% over a full season and you are looking at a top-five possession team in the entire league. Last season, eight out of ten teams with the best CF% made the playoffs. That is not a coincidence. It is a proxy for territorial control, and territorial control eventually converts to goals, which converts to wins, which should convert to shorter moneyline odds. When it does not, you have a bet.
The workflow I follow is straightforward. Each morning I pull five-on-five CF% for both teams in a given matchup, look at rolling ten-game windows rather than full-season averages to capture current form, and compare the implied win probability from the possession split against the implied probability baked into the moneyline. If the possession data says Team A should be winning 55% of the time but the bookmaker is pricing them at odds that imply only 48%, that gap is my entry point.
Fenwick refines the picture by stripping out blocked shots, which are partly a function of shot location rather than pure offensive pressure. Expected goals — xG — goes a step further, weighting each unblocked shot attempt by its probability of becoming a goal based on location, angle and game state. A team can have a middling CF% but a strong xG differential if they are generating chances from the slot rather than flinging pucks from the blue line. I covered this in depth in my guide to Corsi, Fenwick and xG for bettors, but the short version is: use CF% as your first filter and xG as your confirmation.
One trap to avoid is treating possession metrics as gospel on tiny samples. A three-game road trip where a team posted a 47% CF% does not make them a fade candidate if their twenty-game rolling average is 53%. Context matters. Check whether those three games were back-to-backs against division leaders, whether the starting goalie was rested, whether the power play inflated the shot counts. The numbers are a starting point for investigation, not a finish line.
Where this approach pays off most is in the mid-season grind — November through February — when narratives about “hot” and “cold” teams dominate the discourse but possession trends remain stubbornly stable. That is when I find the widest gaps between what the data says and what the line implies, and it is when I bet heaviest.
Exploiting Schedule Density and Travel Fatigue
Picture this: a Western Conference team finishes a game in Vancouver at 10pm Pacific, flies overnight to Florida, lands at noon Eastern, and plays again the following evening. Their legs are heavy, their sleep is fractured, and the bookmaker has only adjusted the line by half a goal. That is a schedule spot, and it is one of the most reliable angles in my entire model.
The 2025-26 season is the last with an 82-game schedule — from 2026-27 the league expands to 84 games per team, which will create even more compressed stretches and more fatigue-driven edges. Already, 82 games crammed into roughly 180 days produces brutal clusters. Teams regularly face three games in four nights, and when those clusters include cross-timezone travel, performance drops are measurable.
I track three variables for every game: days of rest for each team, total miles travelled in the preceding seven days, and the number of timezone boundaries crossed. The rest differential is the simplest and most powerful. When one team has two or more days of rest advantage over its opponent, the rested side wins at a noticeably higher clip than its season average would suggest — and the market rarely prices that in fully, especially when the fatigued team is the bigger name.
Cross-country trips hit hardest. A team flying from the Eastern timezone to the Pacific coast and playing on the first night of a road trip faces a body clock that thinks it is three hours later than the arena clock says. The reverse — a West Coast team flying east — is slightly less punishing because the game starts earlier in their biological day, but the sleep disruption still matters. I flag any game where a team has crossed two or more time zones within 24 hours of puck drop.
Back-to-backs are the classic fatigue spot, but not all back-to-backs are equal. A home-home back-to-back with no travel is manageable. A road-road back-to-back with a flight in between is a red flag. And a road-home back-to-back where the team flew in after an overtime game the night before is close to a guaranteed dip in five-on-five shot generation. I layer these schedule filters on top of the possession model: if a team is already strong on CF% but arrives into a game fatigued, I temper their expected performance. If a weak possession team catches a rested spot at home against a travelling opponent, I look more closely at the underdog price.
The beauty of schedule analysis is that the data is public and free. The NHL publishes its full schedule before the season starts. You can map every fatigue spot months in advance and set alerts for games that meet your criteria. I have a spreadsheet that flags every back-to-back, every three-in-four, every cross-timezone flight, and I review it weekly. It takes twenty minutes and it is one of the highest-return activities in my entire process.

Power Play and Penalty Kill as Predictive Indicators
A friend of mine — sharp bettor, years of experience — once told me he never looks at special teams numbers because “five-on-five is where real hockey happens.” He is half right. Five-on-five drive is the foundation of any good model. But ignoring special teams is like judging a restaurant by the main course and pretending dessert does not exist. In close games, special teams decide the outcome more often than most punters realise.
Power play percentage tells you how efficiently a team converts man-advantage opportunities into goals. The league average hovers around 20-22% in any given season, but the spread between the best and worst units is enormous — sometimes fifteen percentage points or more. A top-five power play facing a bottom-five penalty kill is a specific, identifiable mismatch that the moneyline does not always capture, particularly when the game also features a referee crew known for calling a tight game.
Penalty kill percentage is the defensive mirror, and I would argue it is the more stable of the two metrics. A strong PK% tends to hold up over larger samples because it relies on structure and discipline rather than individual skill. When a team with an elite penalty kill is priced as an underdog, I pay close attention. Their floor in any given game is higher because they are less likely to concede cheap goals on the man-down.

The interaction between the two stats is where the real edge lives. If Team A has a power play converting at 28% and Team B’s penalty kill is operating at 74%, the expected goals from special teams tilt sharply in Team A’s favour. I build a simple expected special teams goals figure for each side of a matchup — multiplying the number of power play opportunities each team typically gets per game by the conversion rate adjusted for the opponent’s kill rate — and fold that into the broader model alongside the five-on-five possession data.
One word of caution: power play percentage is noisy early in the season. A team can run hot at 32% through October on a few lucky bounces and regress to 21% by January. I do not weight PP% heavily until at least 20 games into the schedule. Penalty kill stabilises faster, so I trust it sooner, but even there I prefer a rolling window over a full-season number. The team you are betting on tonight is not the same team that played in October, and your model should reflect that.
Putting It Together — A Simple NHL Betting Model
I spent my first two years of serious NHL betting juggling spreadsheets that looked like they had been designed by a conspiracy theorist — colour-coded tabs, nested IF statements, columns labelled things like “vibes adjustment.” It worked, barely, but it was fragile and impossible to explain to anyone else. The model I use now is stripped back, reproducible and built on four inputs that anyone can gather from free public sources.
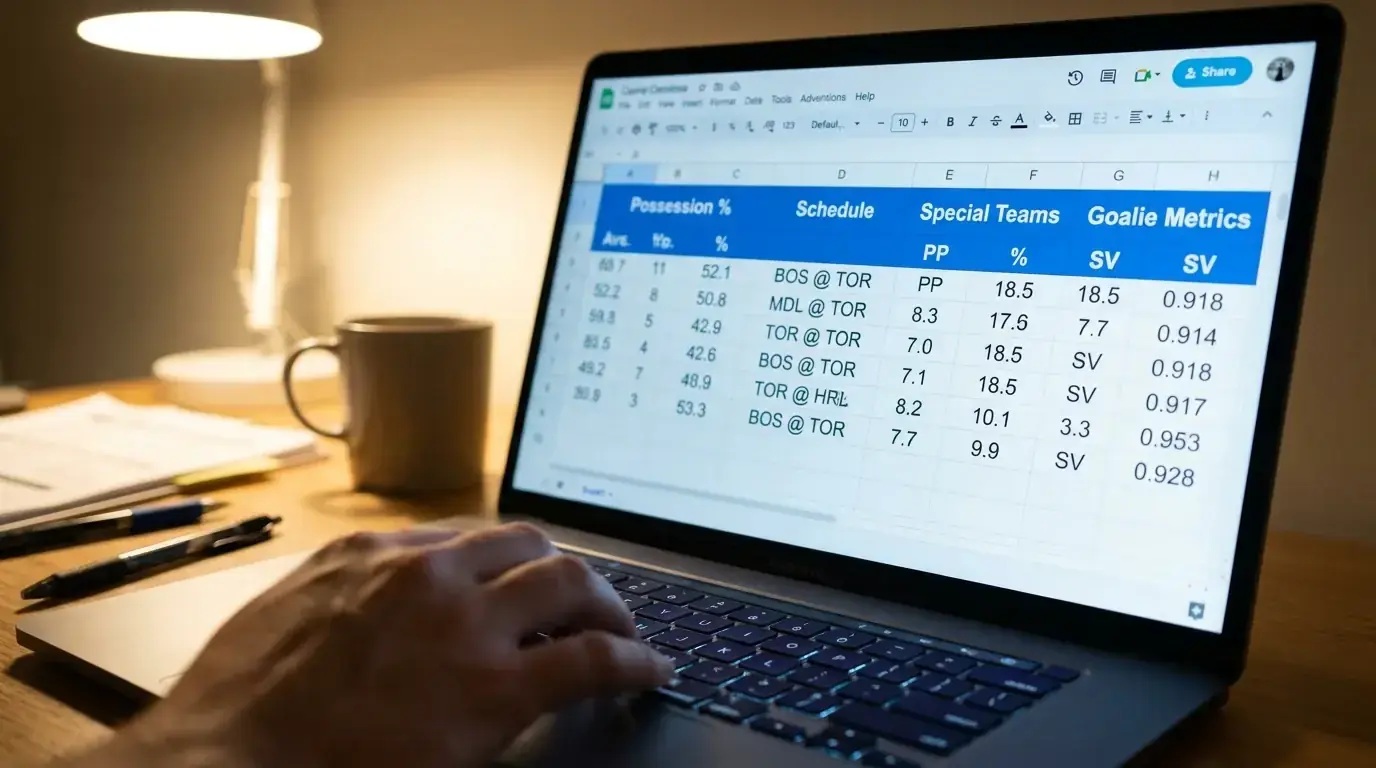
The four pillars are: five-on-five possession (CF% and xG differential, rolling ten-game window), schedule and rest (days off, travel distance, timezone shifts), special teams matchup (adjusted PP% vs opponent PK%, and vice versa), and goaltending (starter confirmation plus recent save percentage). Each pillar produces a directional signal — favour the home side, favour the away side, or neutral — and I weight them roughly 40/20/20/20. Possession gets the heaviest weight because it is the most predictive over sample, but the other three act as modifiers that sharpen the picture for any specific game.
Here is how a typical pre-game assessment looks. Say the model tells me Team A, at home, should win 57% of the time based on the combined signals. I convert that to a fair moneyline — roughly -133 in American odds, or 1.75 in decimal. If the bookmaker is offering Team A at 1.85 or better, I have a value bet. If they are offering 1.65, I pass. The discipline is in the passing. Most slates produce one or two bets that clear my threshold, not ten.
Home ice advantage is baked into the possession and schedule pillars rather than treated as a standalone factor, but it is worth understanding the baseline. In the 2024-25 season, home teams won 56.6% of their games. That figure has been remarkably stable across recent seasons, driven by last-change advantage, familiar boards and the energy of a home crowd — a factor that hits harder in hockey than in most sports because the arenas are smaller and louder per square metre. Where I find the most value is not in backing home favourites blindly but in identifying road underdogs whose possession numbers and schedule spots suggest they are better than their price implies.
One decision the model forces you to make is whether to bet the full-game moneyline or the regulation-time three-way market. In the full-game line, overtime and the shootout are included, so there is always a winner. In the regulation-time market, you can back the draw — which hits roughly 23-24% of the time across a season. Each market has different value profiles. I have written a dedicated breakdown of when the three-way market beats the moneyline, but the key insight for the model is this: if your edge is built on five-on-five possession dominance, the regulation-time line often prices that more accurately because overtime is a coin-flip-like three-on-three format where possession metrics from five-on-five play lose their predictive power.
The model is deliberately simple because complexity is the enemy of consistency. I have tested versions with twelve inputs, versions that include referee tendencies, versions that factor in arena altitude. None of them outperformed the four-pillar version over a full season, and all of them were harder to maintain. The edge in NHL betting does not come from having the most sophisticated model. It comes from applying a good-enough model with discipline, staking consistently, and not overriding the numbers when your gut disagrees. My gut was the thing that went 4-11, remember. The spreadsheet is what turned things around.
Regular Season vs Playoffs — Adjusting Your Approach
Every April I get a wave of messages from mates who ignored the NHL all winter and suddenly want picks for the Stanley Cup playoffs. I tell them the same thing every time: the strategy that worked in January will hurt you in April if you do not adjust.
The regular season is an 82-game marathon where fatigue, schedule spots and sample size work in the bettor’s favour. Teams play through minor injuries, rest starters on back-to-backs, and occasionally coast through low-stakes divisional games. All of that creates noise, and noise is where a data-driven model thrives because the market overreacts to recent results while the underlying possession metrics stay stable.
Playoffs are the opposite. Every game matters. Coaches shorten their benches, lean on their top six forwards and ride their number one goalie until he drops. The intensity rises, the checking gets tighter, and scoring drops. Shot volumes decrease because teams play more conservatively, and the shots that do get through tend to come from lower-danger areas because defensive structures tighten. That means five-on-five CF% and xG differentials compress — the gap between the best and worst possession teams shrinks considerably in a seven-game series.

What gains importance is goaltending. A hot goalie can steal a series against a team that dominates every other metric. I increase the goaltending weight in my model from 20% to roughly 30% once the playoffs begin, and I reduce the schedule pillar to near zero because rest days between games are built into the playoff format. Special teams stay at 20% or climb slightly higher, because power play opportunities in the playoffs often come at pivotal moments — a late penalty in a one-goal game can decide an entire series.
Pricing shifts too. The NHL has more than 75 corporate sponsors and the salary cap at $95.5 million means rosters are tightly balanced at the top end. Bookmakers know this and tighten their lines for playoff matchups, which means the juicy value gaps you found in December are harder to locate in May. I compensate by being more selective — sometimes only betting one game per round — and by focusing on series prices rather than individual game moneylines. A series price lets you express a view over a larger sample, which aligns better with a model built on process rather than single-game variance.
The mental shift matters as much as the mathematical one. In the regular season I aim for volume: fifteen to twenty bets per week, small stakes, grinding out a positive expected value over hundreds of wagers. In the playoffs I aim for precision: two or three bets per round, slightly larger stakes, and a willingness to sit out entirely if the model does not flag a clear edge. Gary Bettman likes to say that every platform and every source of revenue is growing — and that includes the playoff betting market, which draws casual money that can temporarily distort lines in your favour if you know where to look.