
Odds Are the Language of Betting — Here Is the Dictionary
I once sat next to a bloke at a Sheffield Steelers game who told me he had been betting on hockey for two years but had never converted odds into implied probability. He just looked at the number and decided whether it “felt” like good value. That is like trying to navigate London without a map — you might stumble onto the right street eventually, but you will waste a lot of time and money getting lost. Odds are not decoration. They are the single most information-dense number on your betting slip, and learning to read them properly is the difference between punting and investing.
The global sports betting market was valued at $119.26 billion in 2025, with projections pushing it past $145.6 billion by 2029. That is an enormous amount of money flowing through systems that price sporting events down to the decimal point. Every fraction of a percentage matters, and in hockey — where the markets are thinner and less scrutinised than football or basketball — understanding exactly what the odds are telling you gives you a structural advantage over the majority of casual bettors who never bother to do the maths.
This guide will take you from the basics of reading odds formats through to identifying when the price on offer is genuinely wrong. Every section includes worked examples using realistic hockey lines, because numbers only make sense when you see them applied to real situations.
Decimal, Fractional and American — One Concept, Three Notations
Before I moved to analysing hockey full time, I spent a confused week trying to reconcile odds from a UK bookmaker showing 6/4 with an American site showing +150 and a European exchange showing 2.50. They were all the same price. Three different ways of expressing identical information, and the format you encounter depends entirely on where the bookmaker is based and which default your platform uses.
Decimal odds are the standard across most UK bookmakers and the format I recommend using for all your analysis. The number represents your total return per pound staked, including the stake itself. If the decimal odds are 2.50 and you bet ten pounds, your total return on a win is twenty-five pounds — ten pounds of stake plus fifteen pounds of profit. The higher the decimal number, the less likely the bookmaker considers the outcome, and the more you stand to win. A price of 1.20 implies a heavy favourite; a price of 5.00 implies a significant underdog.
Fractional odds are the traditional British format and still appear on some platforms, particularly for horse racing. A price of 6/4 means you win six pounds for every four pounds staked, plus your stake back. To convert fractional to decimal, divide the first number by the second and add one: 6 divided by 4 equals 1.5, plus 1 equals 2.50. That is identical to the decimal price above. Fractions like 11/8 or 5/2 are intuitive once you have done the conversion a few times, but they are clunkier for quick mental arithmetic, which is why I switched to decimal years ago and have not looked back.

American odds use a plus-or-minus system anchored to a hundred-unit base. A positive number like +150 tells you how much profit you make on a hundred-unit stake: bet one hundred, win one hundred and fifty. A negative number like -200 tells you how much you need to stake to win one hundred: bet two hundred, win one hundred. To convert +150 to decimal, divide by 100 and add 1: 150 / 100 = 1.5, plus 1 = 2.50. For negative odds like -200, divide 100 by the absolute value and add 1: 100 / 200 = 0.5, plus 1 = 1.50. American odds dominate NHL coverage from US-based sources, so you will encounter them constantly when reading American hockey analysis. Being able to convert on the fly is a basic but essential skill.
My advice: set every platform you use to decimal format, keep a conversion formula bookmarked for when you encounter American lines in articles or podcasts, and never compare odds across formats without converting first. A price that looks generous in one notation might look average in another, and confusion costs money.
Turning Odds Into Implied Probability
This is where odds stop being abstract numbers and start being useful. Every set of odds encodes a probability — the bookmaker’s estimate of how likely an outcome is to happen, plus a margin for their profit. Extracting that probability is a one-step calculation that I do for every single bet before I consider placing it.
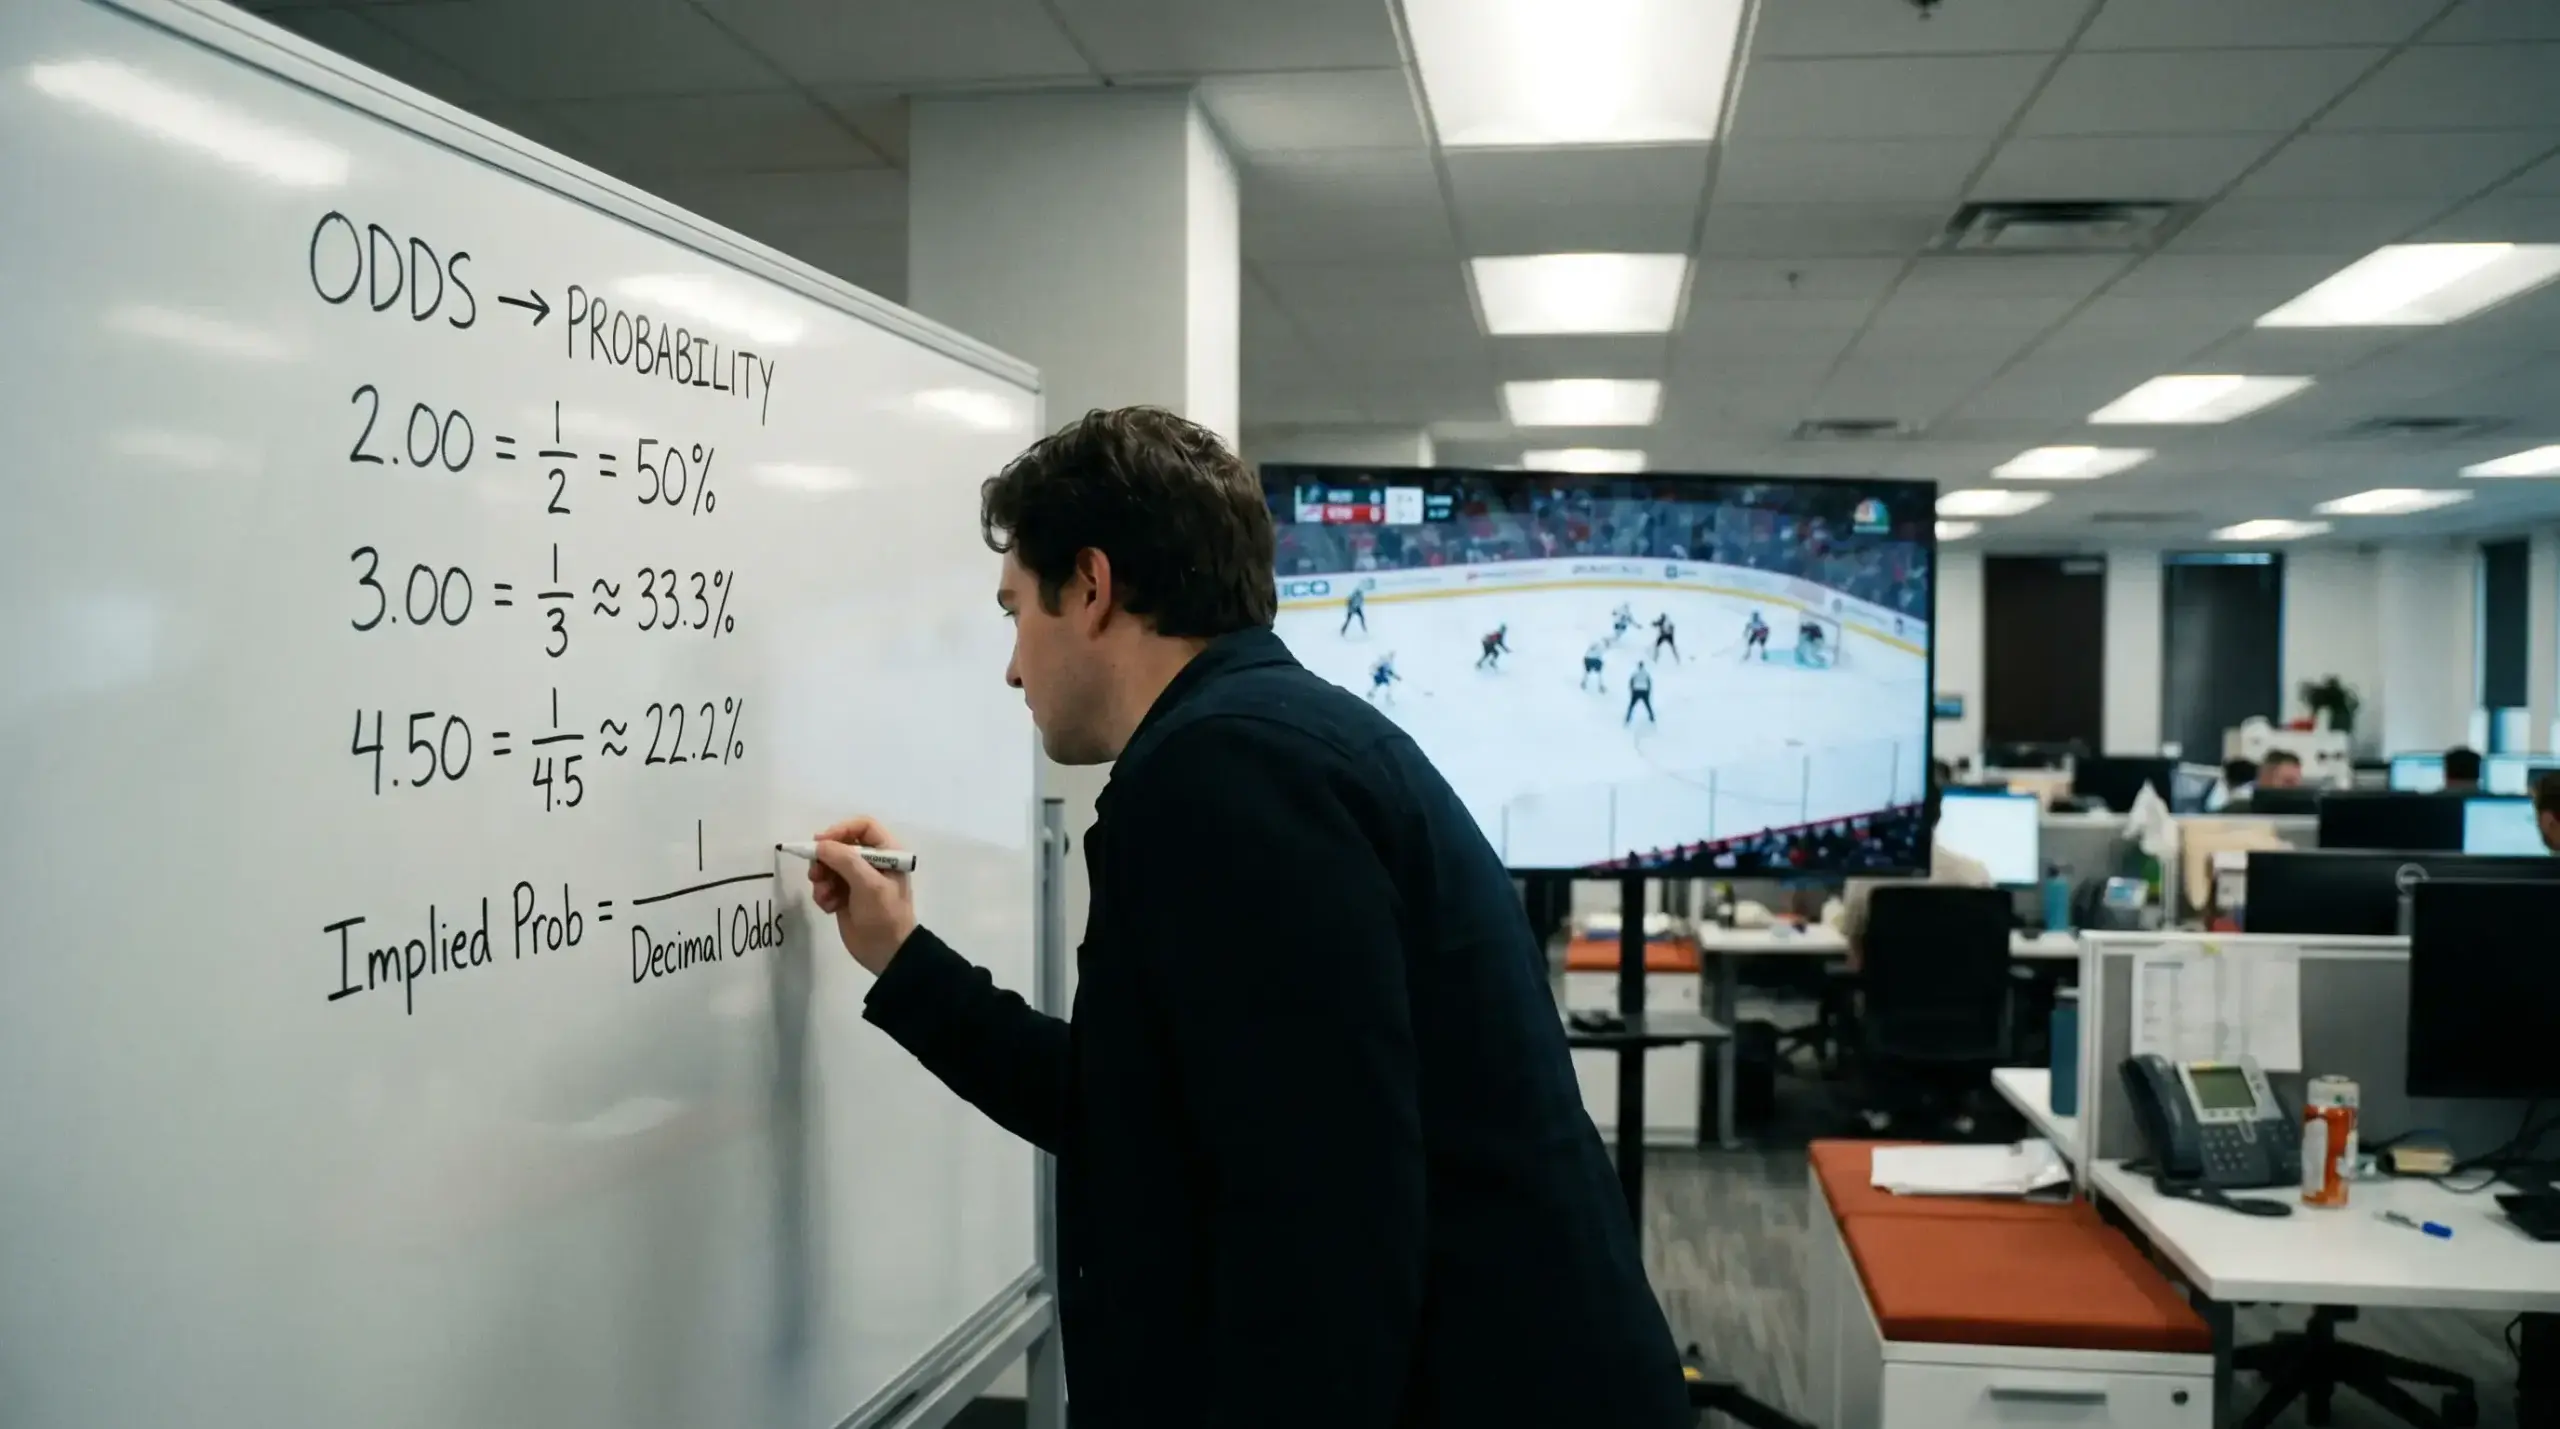
The formula for decimal odds is: implied probability = 1 / decimal odds. If a team is priced at 2.00, the implied probability is 1 / 2.00 = 0.50, or 50%. If they are priced at 1.50, the implied probability is 1 / 1.50 = 0.667, or 66.7%. If they are priced at 3.00, it is 1 / 3.00 = 0.333, or 33.3%. That is all there is to it.
Now here is the critical bit. If you add up the implied probabilities of all outcomes in a market, the total will exceed 100%. In a two-way NHL moneyline market, the favourite might be priced at 1.65 (implied 60.6%) and the underdog at 2.35 (implied 42.6%). The sum is 103.2%, not 100%. That extra 3.2% is the bookmaker’s margin — their guaranteed profit regardless of the result. Understanding this margin, called the overround, is essential for identifying value, and I will return to it in detail shortly.
The reason I calculate implied probability before every bet is that it gives me a number I can compare against my own estimate. If my model says a team has a 55% chance of winning and the bookmaker’s implied probability is 50%, I have a potential edge of five percentage points. If my model says 55% and the implied probability is 58%, the bookmaker thinks the team is more likely to win than I do, and I should pass. Without this conversion, you are comparing your qualitative feeling against a number, which is like comparing the smell of a meal to its calorie count — they measure different things.
How Bookmakers Set and Move Hockey Lines
A question I heard at a hockey betting meetup in Manchester last year: “Do bookmakers just pick a number they think is right?” The answer is more interesting than that, and understanding the process gives you insight into where the price might be wrong.
Bookmakers start with a statistical model. For NHL games, the major operators feed in team ratings, recent form, home-away splits, goaltending data, injury reports and historical head-to-head results. The model spits out a probability for each outcome, and the odds compiler converts those probabilities into prices, adds the overround margin, and publishes the opening line. For EIHL games, the model is typically simpler — fewer data inputs, more reliance on the compiler’s subjective judgement — which is one reason EIHL odds tend to be softer.

Once the opening line is published, money starts flowing in. If a disproportionate amount of money lands on one side, the bookmaker moves the line to rebalance their exposure. This is why odds change between publication and kickoff. A flood of sharp money on the underdog will push the underdog’s price down and the favourite’s price up. Casual money on the favourite will have the opposite effect. In the NHL, line movement is moderate because the betting volume is lower than in football or basketball. In the EIHL, movement is often minimal because so little money is wagered that the bookmaker does not feel the need to adjust.
In the United States, legal sportsbooks processed $165.58 billion in handle across all sports in 2025 and generated $16.80 billion in gross gaming revenue at a hold rate of 10.15%. The first quarter of 2026 alone saw $43.52 billion in handle. Those are staggering figures, and the sheer volume of money in the US market means NHL lines set by American sportsbooks are generally sharper — closer to the true probability — than lines set by UK bookmakers who treat hockey as a secondary sport. I use the US opening line as a benchmark and look for UK bookmakers whose prices deviate from it. When a UK platform offers a significantly better price than the US consensus, it is usually because their model is less refined for hockey, and that is where I find value.
Comparing Odds Across UK Bookmakers
If you take one actionable lesson from this entire article, let it be this: never bet with a single bookmaker. The price differences between UK platforms on the same NHL game can be substantial, and over a season of regular betting, those fractions of a point compound into hundreds of pounds of difference in your bottom line.
Remote betting in the UK generated approximately $2.4 billion in gross gaming yield, with football and horse racing absorbing the bulk of that volume. Hockey is a niche, and niche markets are where price dispersion is widest. I routinely see differences of 0.10-0.15 in decimal odds between the best and worst UK price on the same NHL moneyline. On a one-hundred-pound bet, the difference between 2.10 and 2.25 is fifteen pounds of extra profit if the bet wins. Multiply that across fifty bets in a season, and you are looking at a meaningful sum.
I use odds comparison tools to check prices before every bet. The process takes thirty seconds: search for the game, scan the column of prices, identify the best available odds, and place the bet on that platform. It is boring, unglamorous work, and it is one of the highest-value habits in all of sports betting. Loyalty to a single bookmaker is a luxury that costs you money.

Market depth matters as much as price. Some UK bookmakers offer comprehensive NHL markets — moneyline, puck line, totals, period betting, player props, futures — while others limit coverage to the moneyline and a basic total. If your strategy relies on puck line or period bets, you need to verify that the platform carries those markets at competitive prices before you commit. I maintain active accounts with four UK platforms specifically because no single one offers the best price and the deepest markets on every game.
For EIHL markets, the comparison exercise is even more important. Fewer bookmakers price EIHL games, the overrounds are wider, and the odds can differ dramatically between the three or four platforms that bother to list them. Checking all available sources before placing an EIHL bet is not optional — it is the minimum standard for serious betting.
The Overround and What It Costs You
The overround is the bookmaker’s built-in profit margin, and it is the tax you pay on every bet whether you realise it or not. I started paying attention to overrounds about five years into my betting career, and I genuinely wish I had started on day one.
Here is a worked example. A bookmaker prices an NHL game with the home team at 1.80 and the away team at 2.10. The implied probabilities are 55.6% and 47.6%, summing to 103.2%. The 3.2% above 100% is the overround. In a perfectly fair market, the prices would be 1.80 and 2.25 (summing to exactly 100%), but no bookmaker offers that because they need a margin to cover their costs and generate profit.
A lower overround means the prices are closer to fair and the bettor is paying less margin. A higher overround means the bookmaker is taking a bigger cut. For major NHL games, overrounds at competitive UK bookmakers typically sit between 3% and 6%. For EIHL games, I have seen overrounds as high as 10-12% on some platforms, which makes finding value significantly harder because the prices are further from reality.
The overround varies by market type within the same game. The two-way moneyline (home or away) usually has the lowest overround because it is the most liquid market. Totals carry a slightly higher margin. Puck lines and period betting carry higher margins still, and player props can have overrounds above 10% even for NHL games. Understanding this hierarchy helps you focus your betting on the markets where the bookmaker’s margin is smallest and your edge has the best chance of surviving the margin tax.
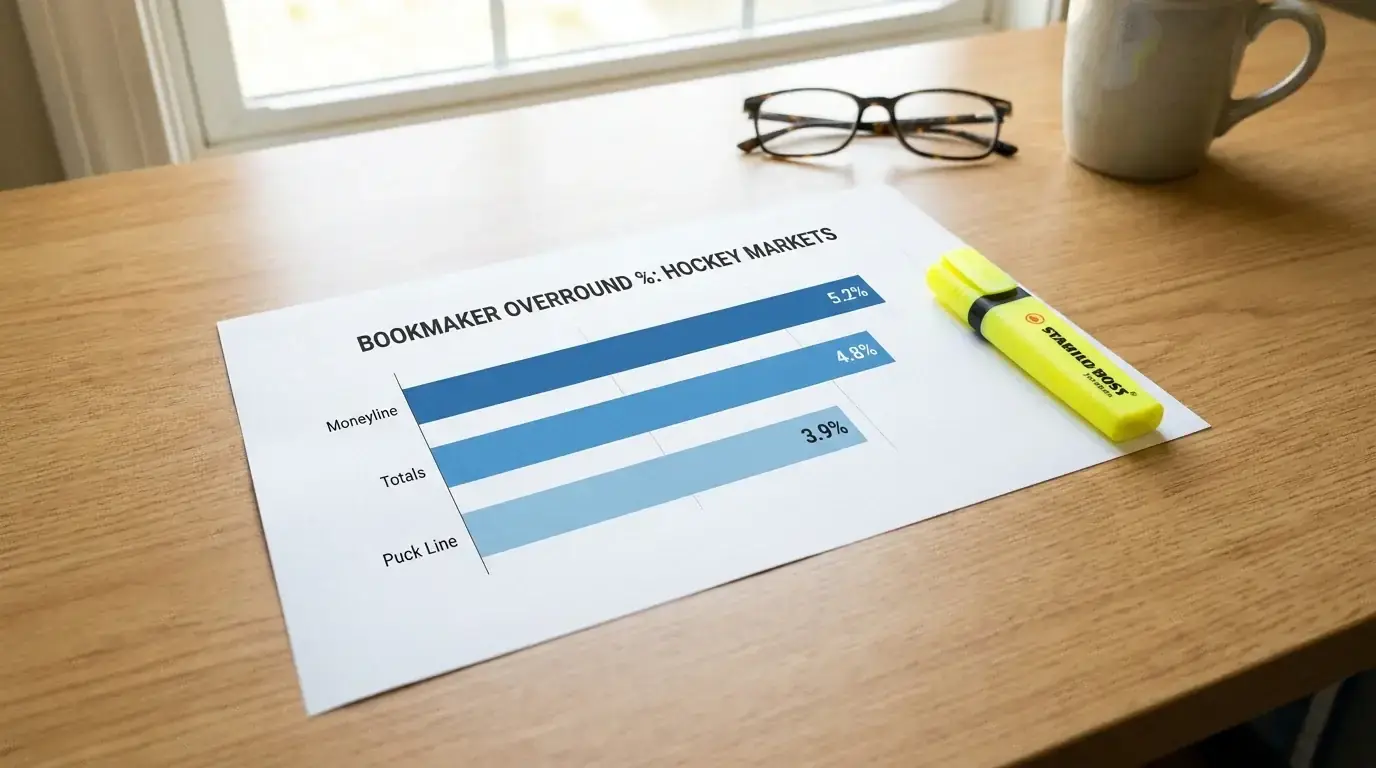
I calculate the overround for every market I consider betting. The formula is simple: sum the implied probabilities of all outcomes in the market. If the sum is 106%, the overround is 6%. If I find the same game priced at 103% on one platform and 105.5% on another, I bet with the first platform every time, assuming the specific odds on my chosen outcome are also better. Overround awareness is not glamorous, but it is one of the easiest ways to improve long-term profitability without changing anything about your selection process.
Spotting Value — When the Price Is Wrong
Value is the only concept that matters in betting, and everything in this article builds toward it. A value bet exists when the true probability of an outcome is higher than the implied probability encoded in the bookmaker’s price. That gap — between what you believe and what the market says — is your edge. Without it, you are gambling. With it, you are investing.
The NHL is one of the last major sports where that gap appears regularly because hockey attracts less betting volume than football, basketball or tennis, and the bookmaker’s model for hockey is less refined as a result. I have had seasons where my closing line value — the difference between the price I bet at and the price the market closes at before puck drop — averaged positive across hundreds of bets. That sustained CLV is the clearest evidence that value exists in hockey markets and that a disciplined approach can capture it.
My process for identifying value starts with the implied probability conversion I described earlier. I calculate what the bookmaker thinks, compare it against my model’s output, and flag any game where the difference exceeds three percentage points. A three-point gap might not sound like much, but over a season of several hundred bets it compounds into significant positive expected value. I wrote a full breakdown of the methodology in my guide to value betting in ice hockey, including how to use closing line analysis as a feedback mechanism to verify whether your value assessments are accurate.
One trap that catches even experienced bettors: confusing a long price with a value price. A team at 5.00 (20% implied) is not automatically a value bet just because the potential payout is large. It is only value if you have a defensible reason to believe the team’s actual win probability is above 20%. Similarly, a short price of 1.40 (71.4% implied) can be a value bet if your analysis says the true probability is 78%. Value has nothing to do with the size of the odds and everything to do with the accuracy of the probability assessment behind them.
The discipline required is uncomfortable. Value betting means backing teams you do not expect to win most of the time, because the price compensates for the losing frequency. It means accepting strings of losses without abandoning the process. It means trusting the maths when your instinct says otherwise. I have gone through ten-bet losing streaks that were entirely within the expected variance of my model, and every one of them tested my commitment to the approach. The bettors who survive those streaks are the ones who understood, before the first bet, what the odds were actually telling them.