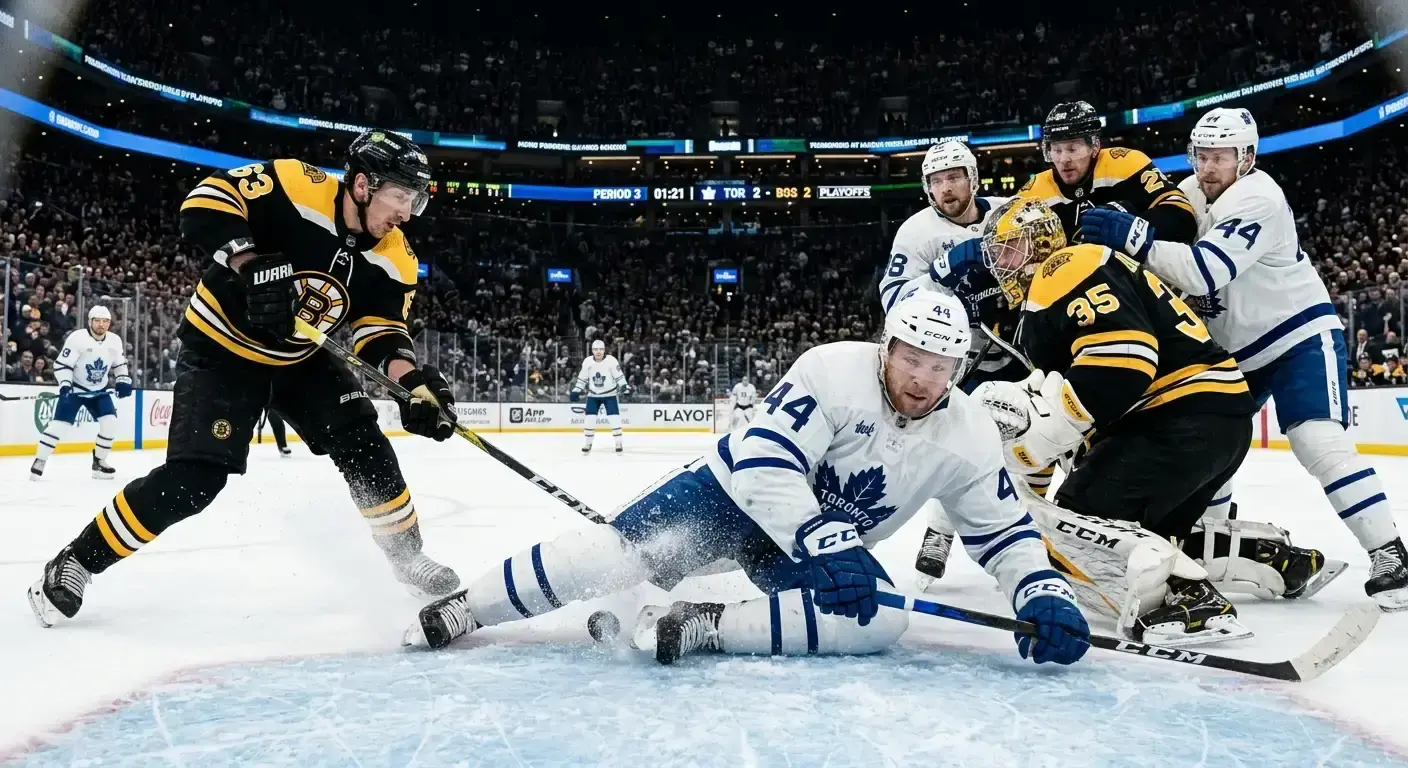

A Different Sport After April
The first time I applied my regular-season model to the NHL playoffs, I lost money for three consecutive rounds. The numbers that had been reliable from October to March — Corsi differentials, power-play conversion, road underdog cover rates — stopped working the moment the postseason started. It took a full playoff cycle of losses before I understood why: the playoffs are not an extension of the regular season. They are a fundamentally different competition, and the betting approach needs to change with them.
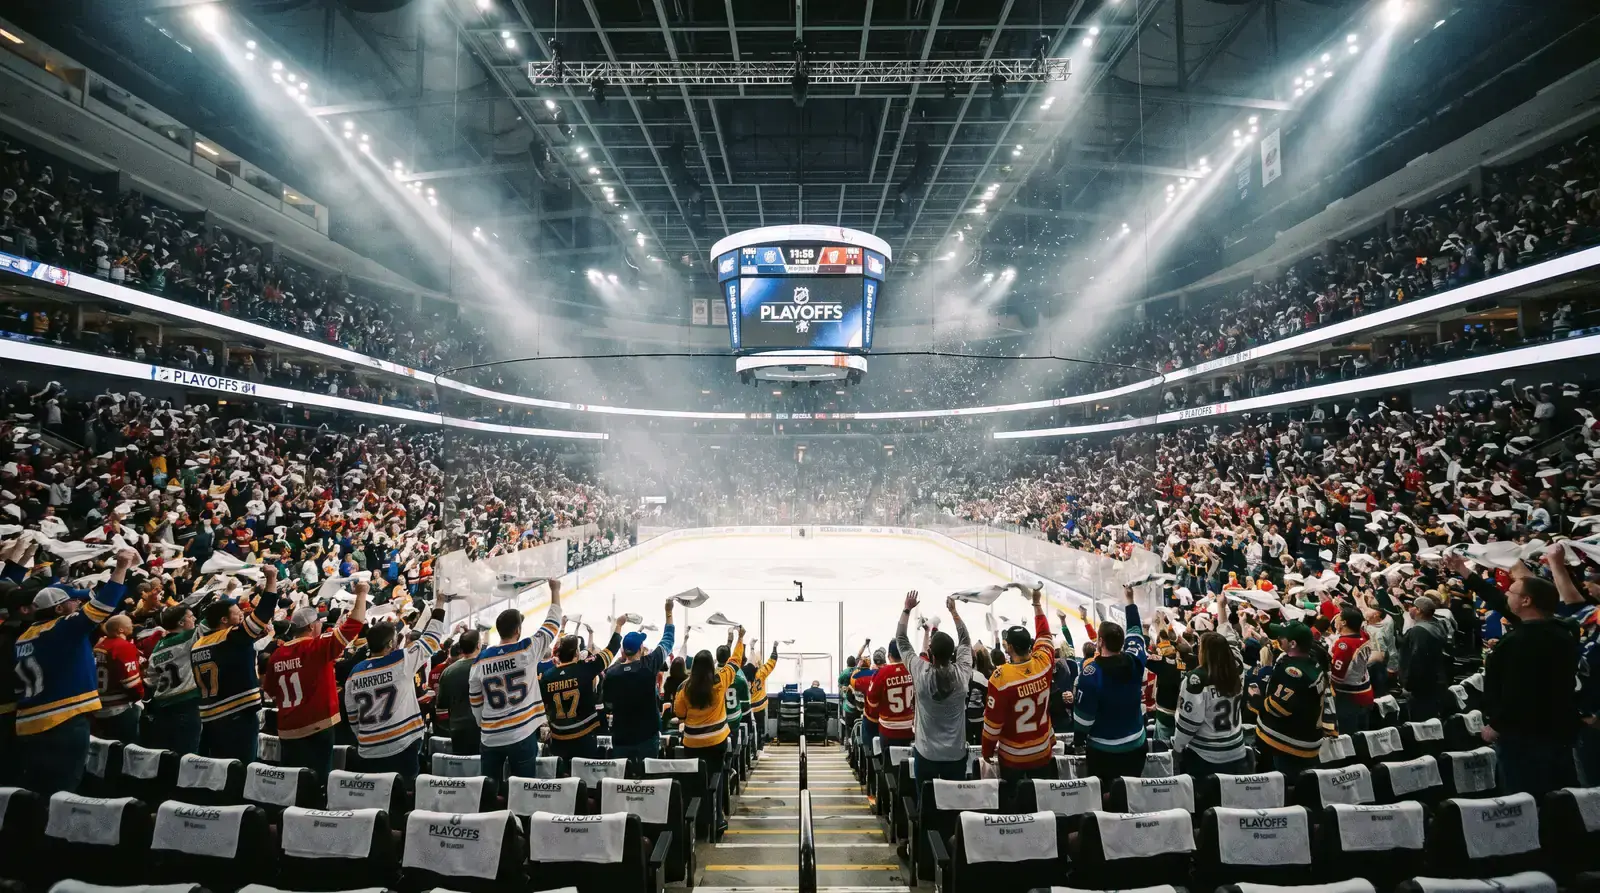
Regular-season hockey involves 82 games against rotating opponents, with coaches managing workloads and resting players for the long haul. Playoff hockey is a best-of-seven series against a single opponent, where every matchup is studied, every weakness targeted, and the intensity ramps up to a level that regular-season data cannot capture. Goaltenders who coasted through February become walls in April. Fourth-liners who averaged nine minutes a night find themselves blocking shots and killing penalties in Game 7. The postseason rewards different attributes than the regular season, and the betting market often adjusts too slowly to reflect that shift.
Why Regular-Season Models Break Down
I tracked the predictive accuracy of my regular-season model through four playoff cycles. Against the spread, it performed worse than a coin flip in the first round and only marginally better in the later rounds. The core problem is sample recency. By the time the playoffs begin, a regular-season model is averaging data from October alongside data from March. A team that overhauled its defensive structure at the trade deadline is being judged partly on numbers generated under a different system.
Playoff-specific factors demand their own weighting. Home teams in the NHL win 56.6% of regular-season games, but the home advantage in the playoffs feels different because the crowd is louder, the coaching deployment is more deliberate (last change becomes even more valuable in a seven-game series), and referees adjust their whistle — typically calling fewer marginal penalties. That officiating shift alone suppresses scoring and favours teams built around defensive structure and goaltending over pure offensive firepower.
The solution is not to discard regular-season data but to filter it aggressively. I weight only the final thirty games of the regular season, adjusting for trade-deadline acquisitions and late-season line changes. I replace season-long goaltending averages with the starter’s performance from March onward. And I add a playoff-experience variable that tracks how deep each team’s core has gone in previous postseasons — because the mental demands of a seven-game series are unlike anything the regular season produces.

Series Pricing and Game-by-Game Adjustments
Bookmakers price playoff series as futures: odds on which team advances. They also price each individual game. The relationship between those two prices creates arbitrage-like opportunities when the market disagrees with itself.
After a team loses Game 1 at home, their series price typically drifts more than the single-game data justifies. One loss in a seven-game series reduces the favourite’s win probability by perhaps 12-15%, but the market often reacts as if the loss was more significant — particularly when it was a blowout. I look for series-price value on the team that lost Game 1 at home, because the overreaction to a single result against the grain of series history tends to create a discount.
Individual game pricing also shifts across a series in predictable ways. By Game 5 or 6, the bookmakers have absorbed enough data to price the matchup tightly. Games 1 and 2 are where the pricing is softest, because the market is extrapolating from regular-season metrics that may not apply. If my playoff-filtered model disagrees with the Game 1 line — a disagreement that occurs in roughly 40% of opening games — that is where I place the largest stakes of the entire postseason.

Goaltending Becomes Everything
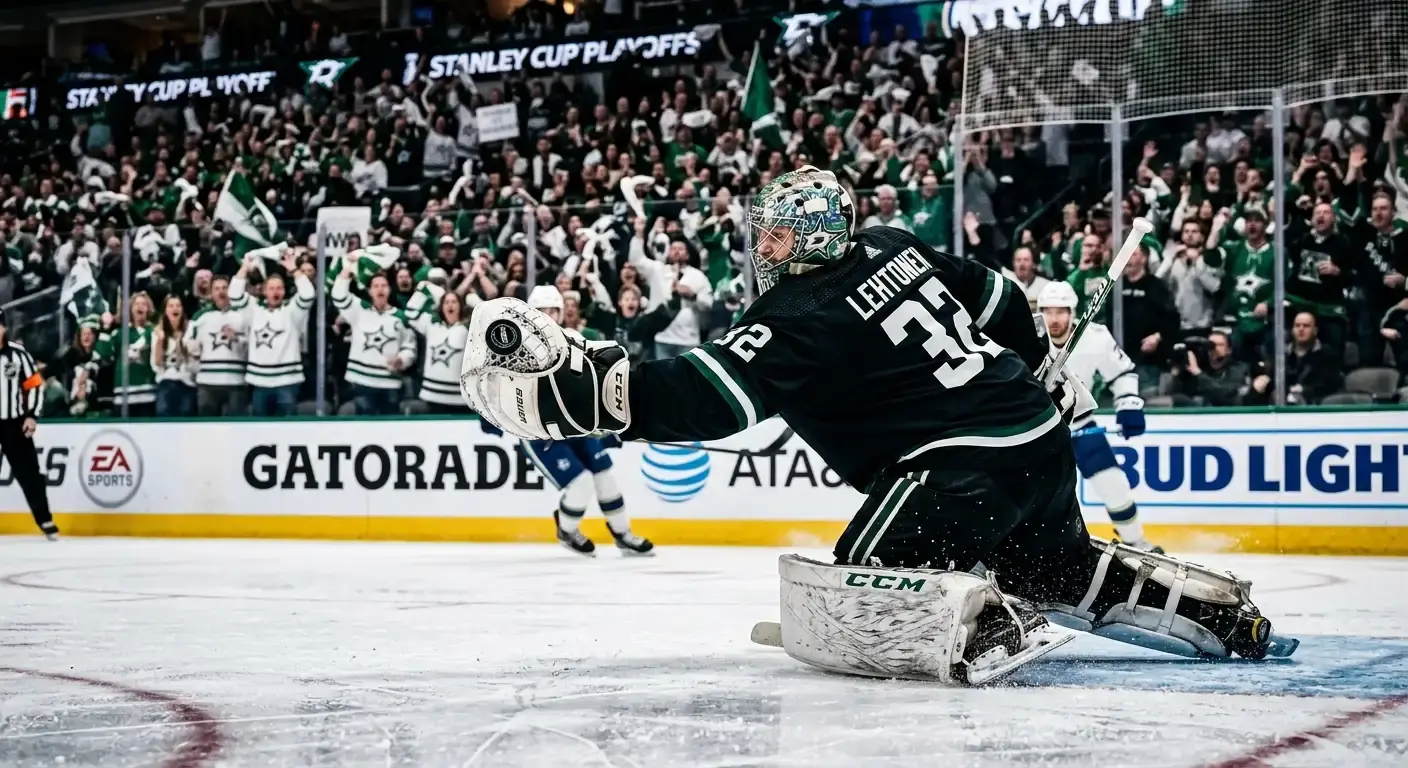
During the regular season, goaltending explains roughly 30% of the variance in game outcomes. In the playoffs, that figure rises because scoring chances are harder to create against tightened defensive systems, and the goals that do occur are often the product of individual brilliance or a single breakdown. The goaltender who sees fewer but higher-quality chances and stops them is the goaltender who wins series.
I evaluate playoff goaltending on three metrics: save percentage on high-danger chances over the final month of the regular season, goals saved above expected during the same window, and career playoff save percentage for starters with at least twenty postseason games. That last metric may sound like a small-sample trap, but playoff goaltending performance is stickier than regular-season performance — the mental composure required for postseason hockey is a trait, not a random fluctuation.
The NHL’s attendance record of 23.16 million fans at 96% capacity means playoff arenas are at full roar, and the crowd factor weighs on visiting goaltenders more than on skaters. A netminder making his first playoff start in a hostile building is a different bet than a veteran who has been through three Conference Finals. I account for that distinction by discounting the expected save percentage of inexperienced playoff goaltenders by roughly two percentage points, which shifts the expected goals against and therefore the value of the moneyline.
Exploiting the Under in Playoff Totals
Playoff scoring drops. It happens every year, and every year the totals market is slow to adjust. Regular-season totals are set around 6.0-6.5; playoff totals should open half a goal lower, but they frequently do not, especially in Games 1 and 2 before the market has playoff-specific data to calibrate on.
The reasons for the scoring drop are structural. Defensive systems tighten because coaches have time to prepare for a single opponent rather than three or four in a week. Checking lines get more ice time. Referees call fewer penalties, reducing power-play opportunities — the easiest source of goals in the regular season. And goaltenders elevate their performance because the stakes demand it and the workload is manageable (a game every two or three days versus four games in six nights).
I target unders in Games 1 and 2 of every first-round series as a default position, then adjust based on the specific matchup. Two teams with elite goaltending and top-ten penalty kills get the maximum stake. Two high-event teams with leaky defences get a pass. The hit rate on early-round playoff unders has been my single most profitable postseason angle over four years of tracking, and the edge persists because the public loves betting overs and the bookmaker happily shades the line to accommodate them.
The goaltending impact guide covers how to evaluate netminders for both regular-season and playoff contexts, including the save-percentage adjustments that matter most when the postseason begins.