

82 Games in 180 Days — Where Fatigue Becomes an Edge
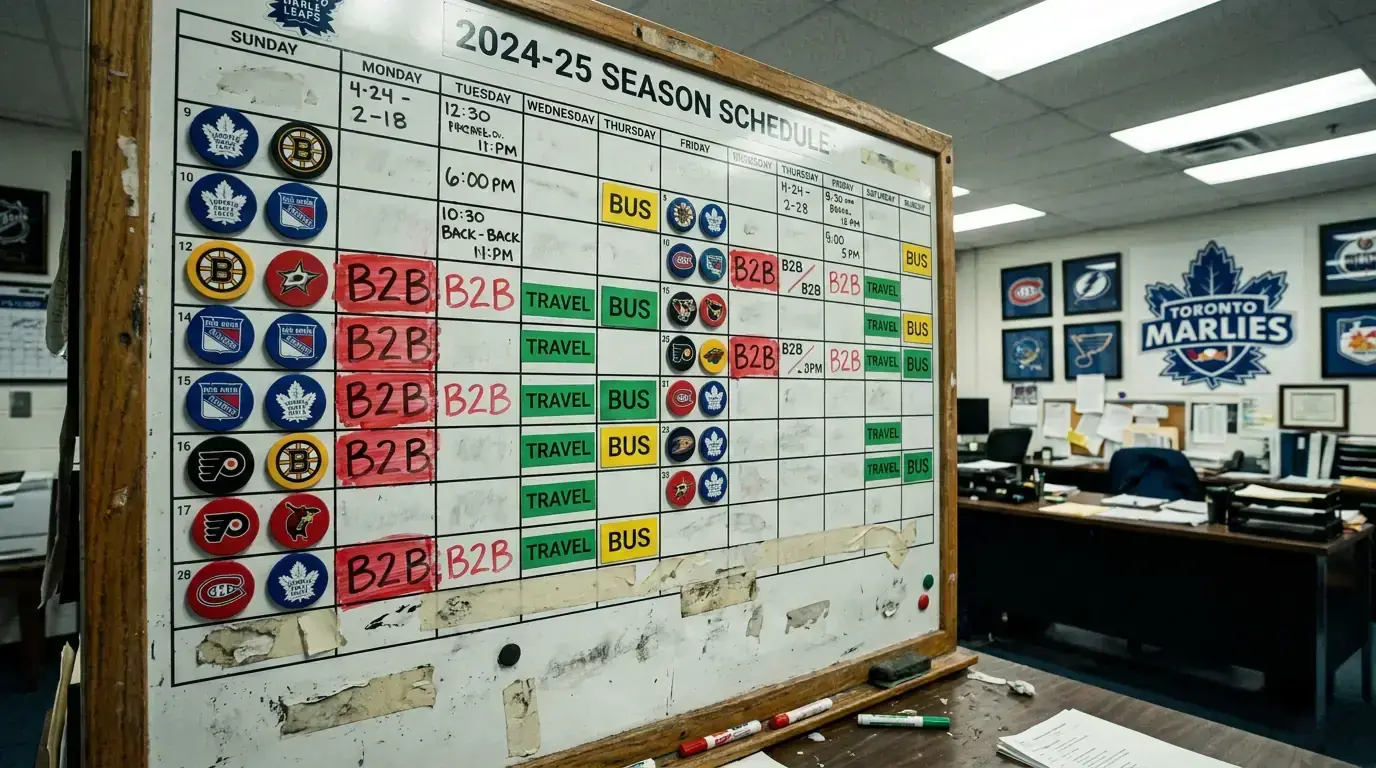
I keep a colour-coded calendar on my wall from October to April. Red squares mark back-to-back games. Yellow marks three-in-four-night stretches. Blue marks cross-timezone road trips. By mid-January it looks like abstract art, and every coloured square is a potential betting opportunity that most punters scroll right past.
The current NHL schedule packs 82 games into roughly 180 days per team, with some weeks demanding four games in six nights. The 2025-26 season is the last under this format — from 2026-27, the schedule expands to 84 games, making fatigue even more relevant. Every team faces the same total workload, but the distribution is wildly uneven. Some clubs get fortunate stretches of three home games in a week; others endure five-game road trips spanning three time zones. Those imbalances are knowable in advance, and they create systematic performance dips that the betting market does not always price correctly.
Fatigue is not glamorous. It does not produce highlight reels or trending hashtags. But it reliably degrades skating speed, defensive positioning and goaltending sharpness — all of which feed directly into the metrics that decide hockey bets.
Back-to-Back Games and Win Rate Drops
The back-to-back is the most studied fatigue scenario in hockey. A team playing the second game in consecutive nights shows measurable performance decline: fewer shot attempts, lower Corsi, more goals conceded, and a win rate that drops below the baseline for both home and road sides.
Home teams win 56.6% of their games overall, but on the second night of a back-to-back that number drops noticeably. The effect is amplified when the first game involved overtime, adding five minutes of high-intensity play to an already compressed recovery window. I flag every back-to-back set in the weekly schedule and check whether the bookmaker’s line adjusts sufficiently. On busy slates with ten or twelve games, the adjustment is often smaller than it should be — the pricing team is stretched, and back-to-back discounts get applied with a broad brush rather than calibrated to the specific travel and rest context.

The wrinkle I look for is asymmetry. When one team is on the second night of a back-to-back and its opponent is rested — ideally with two or more days off — the fatigue gap is at its widest. These matchups occur perhaps once or twice a week across the full slate, and they produce the most reliable schedule-based edges I have found in nine years of betting hockey.
Cross-Country Travel and Time Zone Shifts
Flying from Vancouver to Miami and playing the next evening sounds brutal because it is. A three-hour time zone shift disrupts sleep patterns, meal timing and circadian rhythm. The body does not fully adjust for at least 24 hours, and NHL schedules rarely allow that luxury. A Pacific time zone team playing at 7 p.m. Eastern is effectively dropping the puck at 4 p.m. on its internal clock — the low point of the afternoon energy cycle.
I track westbound and eastbound travel separately because the effects differ. Eastbound travel is generally harder on the body — losing hours compresses the recovery window. Westbound travel gains hours, which helps, but introduces the opposite problem of late-night games that push bedtime past midnight on the player’s home clock. Neither direction is benign, but eastbound trips produce slightly worse performance data in the studies I have reviewed.

The betting application is narrow but profitable. I look for teams that have crossed two or more time zones in the previous 36 hours and are playing an opponent with a stable home schedule. The line rarely adjusts by more than a few cents for travel, and the actual performance deficit is worth more than that in most cases. It is not an everyday play — perhaps three to five qualifying spots per week — but the hit rate has been my most consistent edge over the last four seasons.

Identifying Rest Advantage Spots
Rest advantage is the mirror image of fatigue: one team has had significantly more recovery time than the other. The clearest version is a team coming off three or more days without a game facing a side on the second night of a back-to-back. But subtler versions exist — a team that played one easy home game in four days versus a team that played three road games in the same span. The calendar does not lie; you just have to read it carefully.
My process is mechanical. Every Sunday I map the upcoming week’s schedule for all 32 teams, marking rest days, travel days and game days. I highlight any matchup where one side has a rest advantage of two or more days. Then I check those matchups against my model to see whether the line already accounts for the gap. In about a third of cases, it does not — either the public is chasing a narrative that overrides the schedule data, or the bookmaker’s algorithm treats the game as a standard home-versus-away pricing.
One caution: too much rest can be a negative. Teams with five or more days off sometimes come out flat, lacking game sharpness and rhythm. The sweet spot is two to three days of rest — enough to recover physically without losing competitive edge. I avoid betting rest advantages of five-plus days unless other factors (strong possession metrics, confirmed starting goaltender, home ice) provide additional support.
The home ice advantage guide covers how rested starters at home compound the edge further, especially when the visiting side is on a multi-game road swing.